
How to Turn Plain Facts Into Quotable Statistics for AI
You probably already have dozens of quotable statistics hiding inside your business, blog, customer conversations, and everyday experience.
You know how long a task normally takes.
You know which questions your readers ask repeatedly.
You know which small change improved your sign-ups.
You may know which products produce most of your sales, how often customers get stuck at a particular step, or how much faster a process became after you changed the way you worked.
Right now, however, many of those useful facts may still be sitting inside stories.
And stories are not always easy to extract.
When you turn an honest fact into a clear number, give that number enough context to make sense, and place it somewhere easy to find, you create something much easier for readers and AI systems to understand, remember, and potentially quote.
The goal is not to make your business sound more impressive.
The goal is to make what you genuinely know more measurable.
That distinction matters.
You do not need a huge research department or an expensive survey.
A solopreneur can produce useful statistics from real customer questions, personal results, sales patterns, time measurements, email responses, surveys, and everyday business activity.
The process starts with one simple question:
What number is hiding inside this story?

1. Pull the Number Out of the Story
A lot of useful business knowledge is naturally expressed as an anecdote.
You might say:
Formatting my eBooks used to take forever until I created a better process.
That tells us something.
But it does not tell us very much.
Now imagine you had actually tracked the time:
Formatting an eBook used to take me three hours. My current process takes about one hour.
Suddenly the lesson has a measurable edge.
The story has not changed.
The information has become easier to understand.
You can now see the before and after.
Ask: What Can I Count?
Not every useful statistic has to be a percentage.
Numbers can come from many places:
- time
- frequency
- quantity
- percentage
- ratio
- growth
- reduction
- conversion
- responses
- repeated questions
- number of steps
- number of customers
- number of products
- sales
- email opens
- completion rates
Suppose you keep receiving questions about the same issue.
Instead of saying:
Lots of readers ask me about choosing their first online business idea.
You might review your inbox and discover:
18 of the last 25 beginner questions I received were about choosing the right online business idea.
Now you have something specific.
The important part is that you actually checked.
Your Inbox May Already Contain Data
Every reader question is a small data point.
One question tells you about one person.
Twenty similar questions start revealing a pattern.
A pile of customer conversations can show:
- where beginners get stuck
- which topic creates the most confusion
- what people worry about before buying
- which feature they value most
- which result they are trying to achieve
That information can become useful original data without turning your business into a research laboratory.
You simply need to start noticing and recording it.
2. Do Not Invent a Better Number
This is where things can go wrong.
Numbers feel authoritative.
That makes them powerful.
It also makes dishonest numbers dangerous.
If you do not know that something increased by 42%, do not write 42% because it sounds convincing.
If you are estimating, say so.
For example:
Roughly one third of the people who contact me ask about the same first-step problem.
That is different from claiming:
Exactly 33.4% of my audience has this problem.
One sounds like an honest approximation.
The other sounds like you measured something precisely.
If you did not, the precision is misleading.
Match the Precision to the Evidence
Use exact numbers when you have exact data.
Use approximations when your data is approximate.
You might say:
- 17 of 24 customers
- approximately half
- roughly one third
- close to 40%
- about two hours
- between three and five days
The number should reflect what you genuinely know.
An ordinary but trustworthy statistic is more valuable than an impressive statistic nobody can verify.
3. Give Every Number Context
Consider this:
40%.
That tells us almost nothing.
Forty percent of what?
Over what period?
Compared with what?
Who was measured?
What changed?
A useful statistic needs a frame around it.
Instead of:
Sign-ups increased 40%.
Try:
Email sign-ups increased 40% during the week after I added one customer testimonial to the landing page.
Now we have:
Subject: email sign-ups
Number: 40%
Change: increased
Possible factor: one testimonial
Time period: one week
The number can stand on its own.
A Useful Statistic Formula
A simple structure is:
Subject + Number + Comparison or Change + Context
For example:
Three of my forty digital products currently generate most of my monthly product revenue.
That tells us much more than:
Three products sell really well.
The comparison is what gives the number meaning.
Three successful products sounds nice.
Three products producing most of the revenue from a catalogue of forty gives us something to think about.
4. Use Strong, Accurate Verbs
The number matters.
So does the verb next to it.
Compare:
Sales sort of went up.
with:
Sales doubled.
The second version is clearer because the verb tells us exactly what happened.
Other useful verbs include:
- increased
- decreased
- doubled
- halved
- reduced
- grew
- dropped
- converted
- completed
- opened
- clicked
- responded
- purchased
- finished
Do not make the language stronger than the evidence.
But when you know what happened, say it clearly.
5. Use Comparison to Make the Number Meaningful
Numbers become easier to understand when they are compared with something.
Think about:
Before vs after
My weekly content planning dropped from three hours to 45 minutes after I introduced a repeatable template.
Part vs whole
Four products generated 70% of my digital product revenue last quarter.
One period vs another
Newsletter clicks increased from 12 to 31 after I added a downloadable resource.
Expected vs actual
Setting up the printable shop took one weekend rather than the month I expected.
A comparison answers a question readers often have:
Is that number good, bad, fast, slow, large, small, normal, or unusual?
Without something to compare it with, the reader often cannot tell.
6. Add a Time Frame
Time can turn an ordinary number into useful information.
Compare:
My email list reached 1,000 subscribers.
with:
My email list reached 1,000 subscribers within six months of starting the blog.
The second version helps the reader judge the result.
A time frame might be:
- in seven days
- during the first month
- across 30 customer enquiries
- over six months
- during the launch
- between January and March
- after three email campaigns
- within the first 90 days
Whenever a result changes over time, ask whether the time period belongs in the statistic.
Often it does.
7. Put the Statistic Where People Can Find It
A useful statistic can still disappear if you bury it halfway through a long paragraph.
Give important numbers room.
You can place them:
- immediately beneath the relevant heading
- in the opening sentence of a section
- inside a short standalone paragraph
- in a highlighted callout
- in a comparison box
- inside a checklist
- beside an explanation of the result
Suppose your heading is:
How Long Does It Take to Create a Printable Bundle?
Do not spend three paragraphs before answering.
Start with the useful number:
A small printable bundle typically takes me about one week to create from planning through final review.
Then explain the steps underneath.
The number becomes easy to identify because it appears where the question is being answered.
8. Connect Numbers to Real Questions
Statistics become much more useful when they answer something your audience genuinely wants to know.
For example:
Question: How long does it take?
Statistic: It took seven days.
Question: How much did it improve?
Statistic: Conversion increased by 22%.
Question: Where do beginners struggle?
Statistic: 14 of the last 20 enquiries involved the same setup problem.
Question: Which product performs best?
Statistic: One offer generated 46% of last quarter’s product revenue.
Start with the audience question.
Then find the number that helps answer it.
That keeps your statistics useful instead of turning the article into a random collection of figures.
9. Make Your Best Quotable Statistics Easy to Recognize
Consistency helps.
If you normally write percentages as 40%, continue using that style.
If you write them as forty percent, be consistent with that instead.
The same applies to:
- currency
- dates
- time periods
- decimal places
- percentages
- before-and-after comparisons
Small consistency signals make your content feel more deliberate.
You can also repeat an important statistic later in the article when it genuinely supports another point.
That does not mean copying the same sentence again and again.
State the statistic clearly once.
Then refer back to what it means.
10. Keep Your Quotable Statistics Current
A number can be completely accurate when you publish it and wrong six months later.
Businesses change.
Audiences change.
Prices change.
Platforms change.
Conversion rates change.
Product catalogues grow.
Email lists grow.
If a statistic is important enough to feature prominently, it is important enough to review occasionally.
You could add a simple statistic check to your normal content-update process:
Is this number still true?
If yes, keep it.
If not, update it.
Current data is far more useful than impressive but outdated data.
A Quick AI Prompt for Finding Quotable Statistics
You can use AI to help uncover the numbers hiding inside your existing stories.
Try:
Here are several facts, observations, or short stories from my business. For each one, identify whether there is a measurable number hiding inside it. Suggest what I could count, compare, time, or calculate. Do not invent any figures. If I have not supplied enough information to create an honest statistic, tell me what data I would need to collect. Once a real number is available, help me rewrite it as one clear sentence that includes the subject, number, comparison or context, and time frame where relevant. Keep my natural conversational tone.
The important instruction is:
Do not invent any figures.
AI can help you frame your evidence.
It should not manufacture the evidence.
The Quotable Statistics Formula
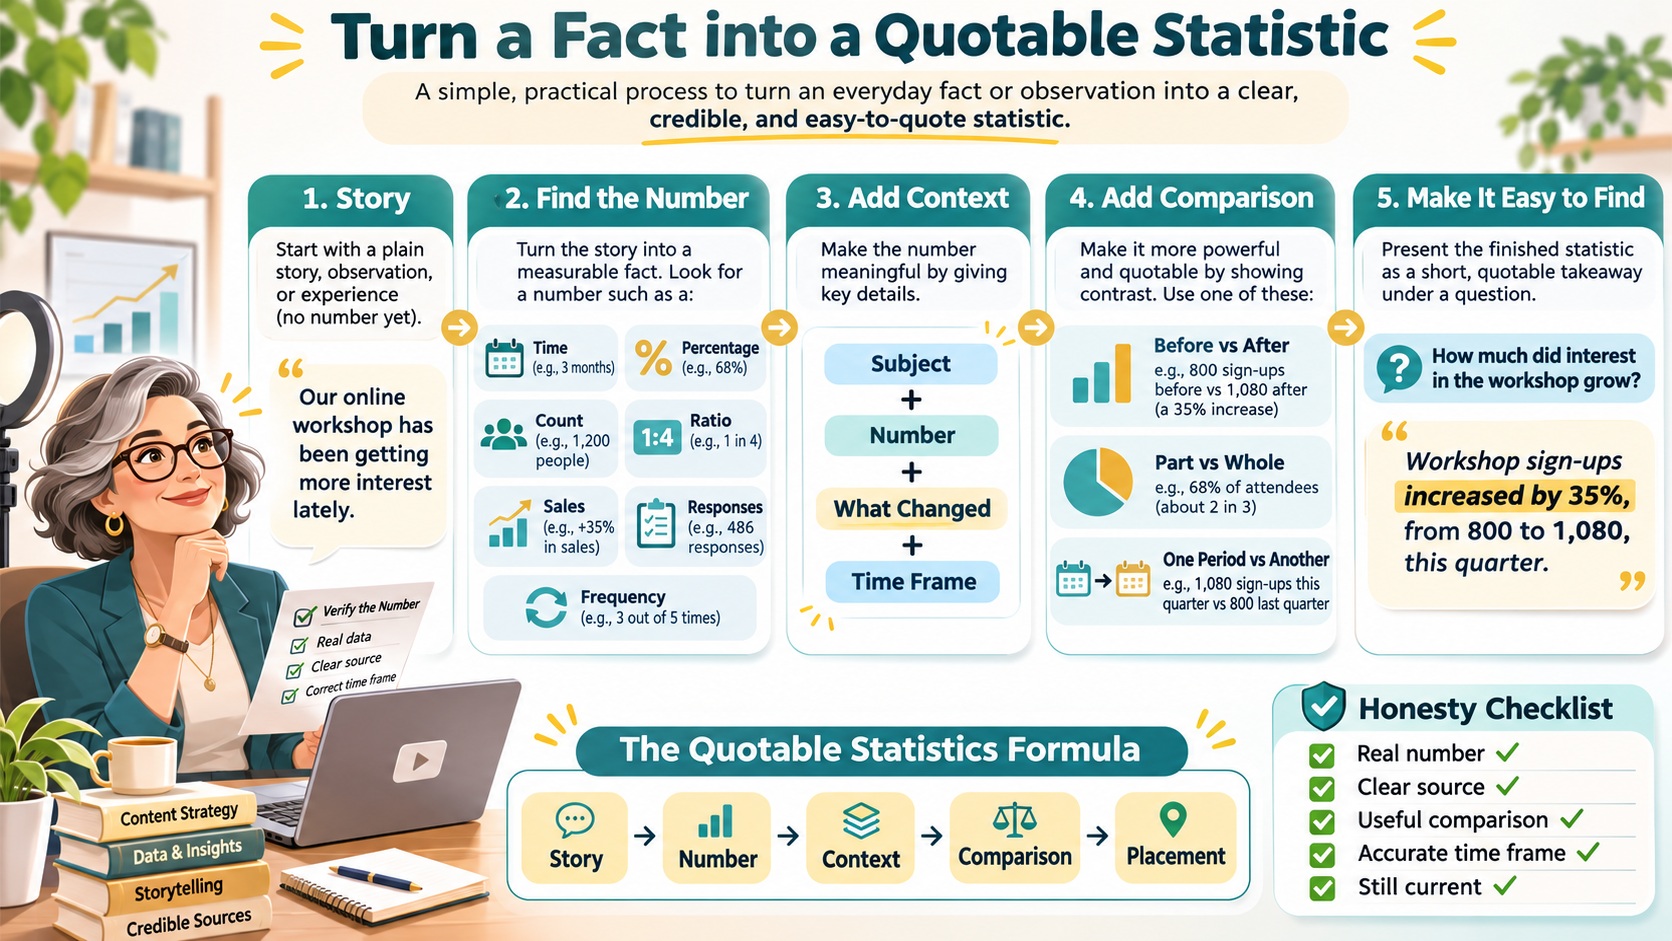
A useful way to remember the process is:
Story → Number → Context → Comparison → Placement
Start with something you already know.
Find what can genuinely be measured.
Give the figure enough context to make sense.
Compare it with something useful when appropriate.
Then place it near the question it answers.
A Simple Statistic Test
Before publishing a statistic, ask:
- Is the number real?
- Can I explain where it came from?
- Does the sentence name what was measured?
- Is the comparison clear?
- Is the time period relevant?
- Does the precision match the evidence?
- Can the statistic make sense by itself?
- Does it answer a question my audience actually asks?
- Is it placed somewhere easy to find?
- Is it still current?
If you can answer yes to those questions, you probably have something far stronger than a vague claim.
Your Most Useful Data May Already Exist In Your Quotable Statistics
You may already be sitting on useful original data.
It could be inside:
your inbox,
your customer questions,
your email statistics,
your content analytics,
your sales records,
your project notes,
your launch results,
your surveys,
your workflow timings,
or simply the experience you have accumulated after doing the same task many times.
You do not necessarily need more information.
You may simply need to measure what you already know.
Start with one story.
Ask:
What number is hiding inside this?
Find the honest figure.
Give it context.
Put it somewhere easy to find.
That small change can turn an ordinary fact into the kind of statistic people remember, repeat, and potentially cite.
 Join the Challenge: Access Classroom · The Opportunity Lab™ Today
Listen to our Podcast Channel – The Opportunity Hub Podcast Channel
Read:
Systeme.io Review: All-in-One Business Platform
Effective Strategies for Incorporating AI in Your Business Operations
Best AI Marketing Tools for Boosting Your Online Business
Ultimate Guide to Mastering AI Copywriting Techniques in 2026
Top 10 AI Content Creation Tips for High-Quality AI-Driven Content
Top 5 AI Copywriting Mistakes to Steer Clear Of
The 4 Cs of Better AI Copy / Mastering AI Copywriting: 7 Essential Frameworks Revealed
Improve AI Content Over Time / Top 10 AI Content Creation Tips
📅 Last updated:
